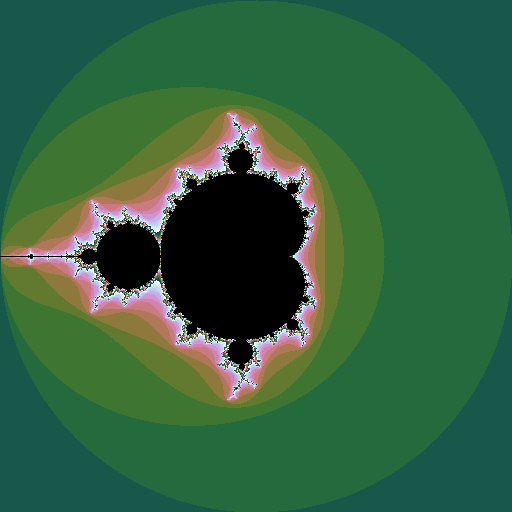
The Mandelborot set is a highly complex fractal generated from a very simple equation. Consider the sequence \(z_0=0; z_{n+1} = z_n^2 + c\), where \(z\) and \(c\) are complex numbers. For some values of \(c\), the sequence diverges to infinity; for other values it stays bounded. The Mandelbrot set is all the values of \(c\) for which the sequence does not diverge. Plotting these points in the complex plane (and plotting the points that do diverge in colours that represent how fast they diverge) gives the now well-known picture:
If \(z\) is raised to a different power, different sets are seen, still with complex shapes.
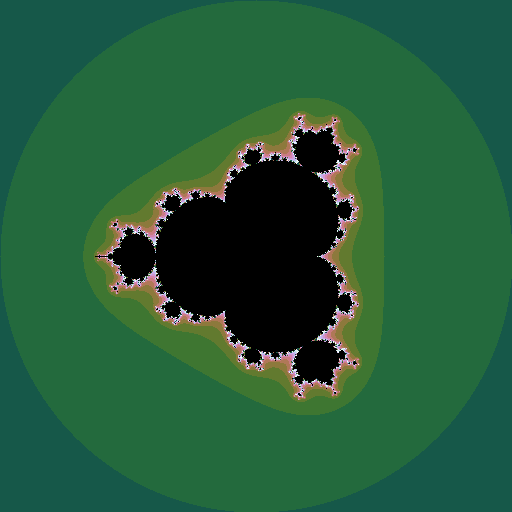 |
| iterating \(z^4 + c\) |
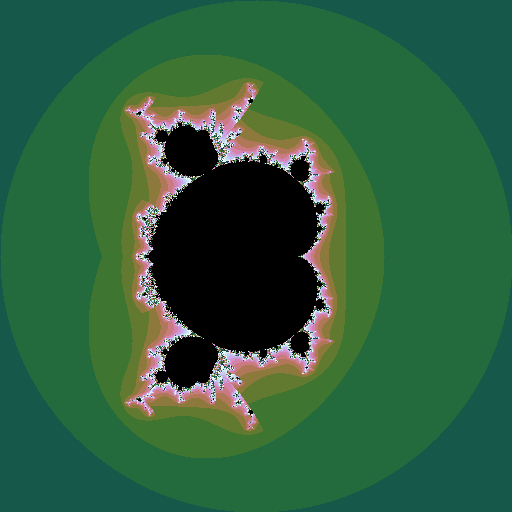 |
| iterating \(z^{2.5} + c\) |
We can make an animation of the shape of the set as this power \(k\) changes:
 |
| \(k = 1 .. 6\), step \(0.05\) |
One thing I love about the Mandelbrot set is the sheer simplicity of the code needed to plot it:
import numpy  as np
import matplotlib.pyplot as plt

IMSIZE = 512 # image width/height
ITER = 256

def mandelbrot(c, k=2):
    # c = position, complex; # k = power, real
    z = c
    for i in range(1, ITER):
        if abs(z) > 2:
            return 4 + i % 16 #16 colours
        z = z ** k + c
    return 0

mandy = np.zeros([IMSIZE,IMSIZE])
for ix in range(IMSIZE):
    x = 4 * ix / IMSIZE - 2
    for iy in range(IMSIZE):
        y = 2 - 4 * iy / IMSIZE
        mandy[iy,ix] = mandelbrot(np.complex(x,y), k)

    plt.axis('off')
    plt.imshow(mandy, cmap='cubehelix')
    plt.show()
And there's more. But that's for another post.
No comments:
Post a Comment