The latest batch:

The latest batch:
This isn’t actually about how to do “nothing”: it’s about how to do something meaningful, rather than the nothing that results from being trapped in the shallows of social media and “the attention economy”, of consumerism and incessant productivity. It’s about how to disengage from that time-suck, and how to use the resulting time beneficially.
The argument goes something like this. The attention economy is bad for us: it grabs our attention but doesn’t give anything in return; it’s like junk food engineered for craving more rather than providing nutrition. However, we can’t just walk away from the world and become a hermit: we need some contact with it to function, to keep in touch, to do our work; we are social beings. So we need to “resist in place”: do what is needed, but no more. This is of course difficult, because the digital world is engineered to make it hard to ignore; consumerism is the way our world current runs; not everyone has the resources to just stop.
Odell suggests that one way to resist is to pay “deep attention”, to go down rabbit holes. Rather than skimming over the surface glitter, dig down in one place, and notice, and think. The approach that worked for her stemmed from bird watching. Initially this was paying enough attention to distinguish species; this led to noticing where and when they turned up. From there, it was a short step to thinking about the plants and the local ecology, and further. She describes the experience as “re-rendering” her reality, seeing the world in a new, different way. Ecology is about networks, flows, and a lack of sharp, easily defined boundaries; this less sharply-defined reality needs extra attention and effort to see.
Odell suggests that deep connection with the natural world is what is needed. However, I think many more things are sufficiently fractal to work: you can pay attention and dig deep and discover more and more wherever you start: probably any initial hobby or interest can lead to ever-increasing depth and richness: from birds to ecology; from sport to physiology or economics or equipment design; from crafting to materials engineering and science, or supply chains, or sustainable raw material production; and so on. Indeed, Odell uses discovery of this ever deepening complexity and context as evidence we do not live in a context-free simulation:
[p126] Unlike the manufactured Main Street Cupertino, [the creek] is not there because someone put it there; it is not there to be productive; it is not there as an amenity. It is witness to a watershed that precedes us. In that sense, the creek is a reminder that we do not live in a simulation—a streamlined world of products, results, experiences, reviews—but rather on a giant rock whose other lifeforms operate according to an ancient, oozing, almost chthonic logic. Snaking through the midst of the banal everyday is a deep weirdness, a world of flowerings, decompositions, and seepages, of a million crawling things, of spores and lacy fungal filaments, of minerals reacting and things being eaten away—all just on the other side of the chain-link fence.
Odell finishes by talking of what comes next, after this deep attention has brought (in her case) the ecology front and centre. This ecology has been damaged, and is in need, not necessarily of restoration to some previous supposedly pristine state, but certainly of remediation, to a better, more healthy state. This requires seeing the complexity of what was there originally, and working with that complexity, in a form of “patient collaboration”. This work has no endpoint; it is a process of becoming.
I was surprised to find this turned into a book about the complexity of ecology, so soon after having read What Should a Clever Moose Eat?. They make a good pair. Even it you don’t want to turn your attention to ecology, but rather start with some other hobby or topic of choice, there is a lot to think about in this discussion. Stop consuming digital junk; pay attention to your mental nourishment!
Midway through the week-long UCNC conference, today we had two great talks, a group photo, and the conference outing.
First up, Mika Hirvensalo gave a (remote) presentation on "41 years of quantum computing" as an introduction to the QC workshop to come on Friday. The "41 years" refers to Feynmann's 1982 paper of simulating quantum physics. Of course, quantum mechanics itself is somewhat older than that, but Feynmann was arguably the first to consider it as the basis for a computational use. Mika's talks covered a variety of historical themes: quantum computing itself, from von Neumann's (pre-Shannon) definition of quantum entropy, via Feynmann, the Deutsch and Shor algorithms, and more recent work on quantum complexity theory; some pre-history of quantum physics itself, starting with Young's two slit experiment; and practical milestones in building (small, noisy) quantum computers, from 2 bit NMR, via ion traps and photons, D-Wave's annealer, to qubit circuit machines. A fascinating perspective.
Next up, Lila Kari gave a keynote on using mathematical analyses of DNA sequences to investigate environmental adaptations of extremophile genomes. There was a lot of fascinating detail here about the biology of the bugs, and how to analyse them. I really loved the use of the "chaos game" algorithm to turn a genome sequence into a 2D fractal plot, where differences and similarities are clearly apparent on visual inspection.
We moved outside into the warm Florida sunshine for a photograph. (The locals kept apologising for the bad weather: although it was sunny, it was "only" in the low 20s (Celsius), which as far as I was concerned is perfect weather!) In olden days a conference photograph was a formal affair, all lined up with a proper photographer taking the picture. Nowadays, loosely group everyone on a convenient staircase, snag a passer-by to be the photographer, and snap a few pictures on a smartphone.
Then off to the conference outing, to the "old" town of St. Augustine. The campus is deserted this week, because it is spring break; St Augustine was packed, for similar reasons. But we had a good walk round, enjoying the old town (which looked suspiciously new in places), the fort, the shore, and some key lime pie.
 |
| the old fort |
 |
| panoramic view: there were fewer people here, probably because it was quite breezy and nicely cool |
 |
| a view across the bay |
 |
| trees in the town centre, draped in Spanish moss; beautiful |
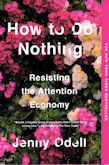
 |
| 42 million randomly chosen values of \(c\) |
import numpy  as np
import matplotlib.pyplot as plt

IMSIZE = 2048 # image width/height
ITER = 1000

def mandelbrot(c, k=2):
    # c = position, complex; k = power, real
    z = c
    traj = [c]
    for i in range(1, ITER):
        z = z ** k + c
        traj += [z]
        if abs(z) > 2: # escapes
            return traj, []
    return [], traj

def updateimage(img, traj):
    for z in traj:
        xt, yt = z.real, z.imag
        ixt, iyt = int((2+xt)*IMSIZE/4), int((2-yt)*IMSIZE/4)
        # check traj still in plot area
if 0 <= ixt and ixt < IMSIZE and 0 <= iyt and iyt < IMSIZE:
            img[ixt,iyt] += 1

# start with value 1 because take logs later
buddha = np.ones([IMSIZE,IMSIZE])
abuddha = np.ones([IMSIZE,IMSIZE])
for i in range(IMSIZE*IMSIZE*10):
    z = np.complex(np.random.uniform()*4-2, np.random.uniform()*4-2)
    traj, traja = mandelbrot(z, k)
    updateimage(buddha,traj)
    updateimage(abuddha,traja)

buddha = np.square(np.log(buddha)) # to extend small numbers
abuddha = np.log(abuddha)          # to extend small numbers

plt.axis('off')
plt.imshow(buddha, cmap='cubehelix')
plt.show()
plt.imshow(abuddha, cmap='cubehelix')
plt.show()
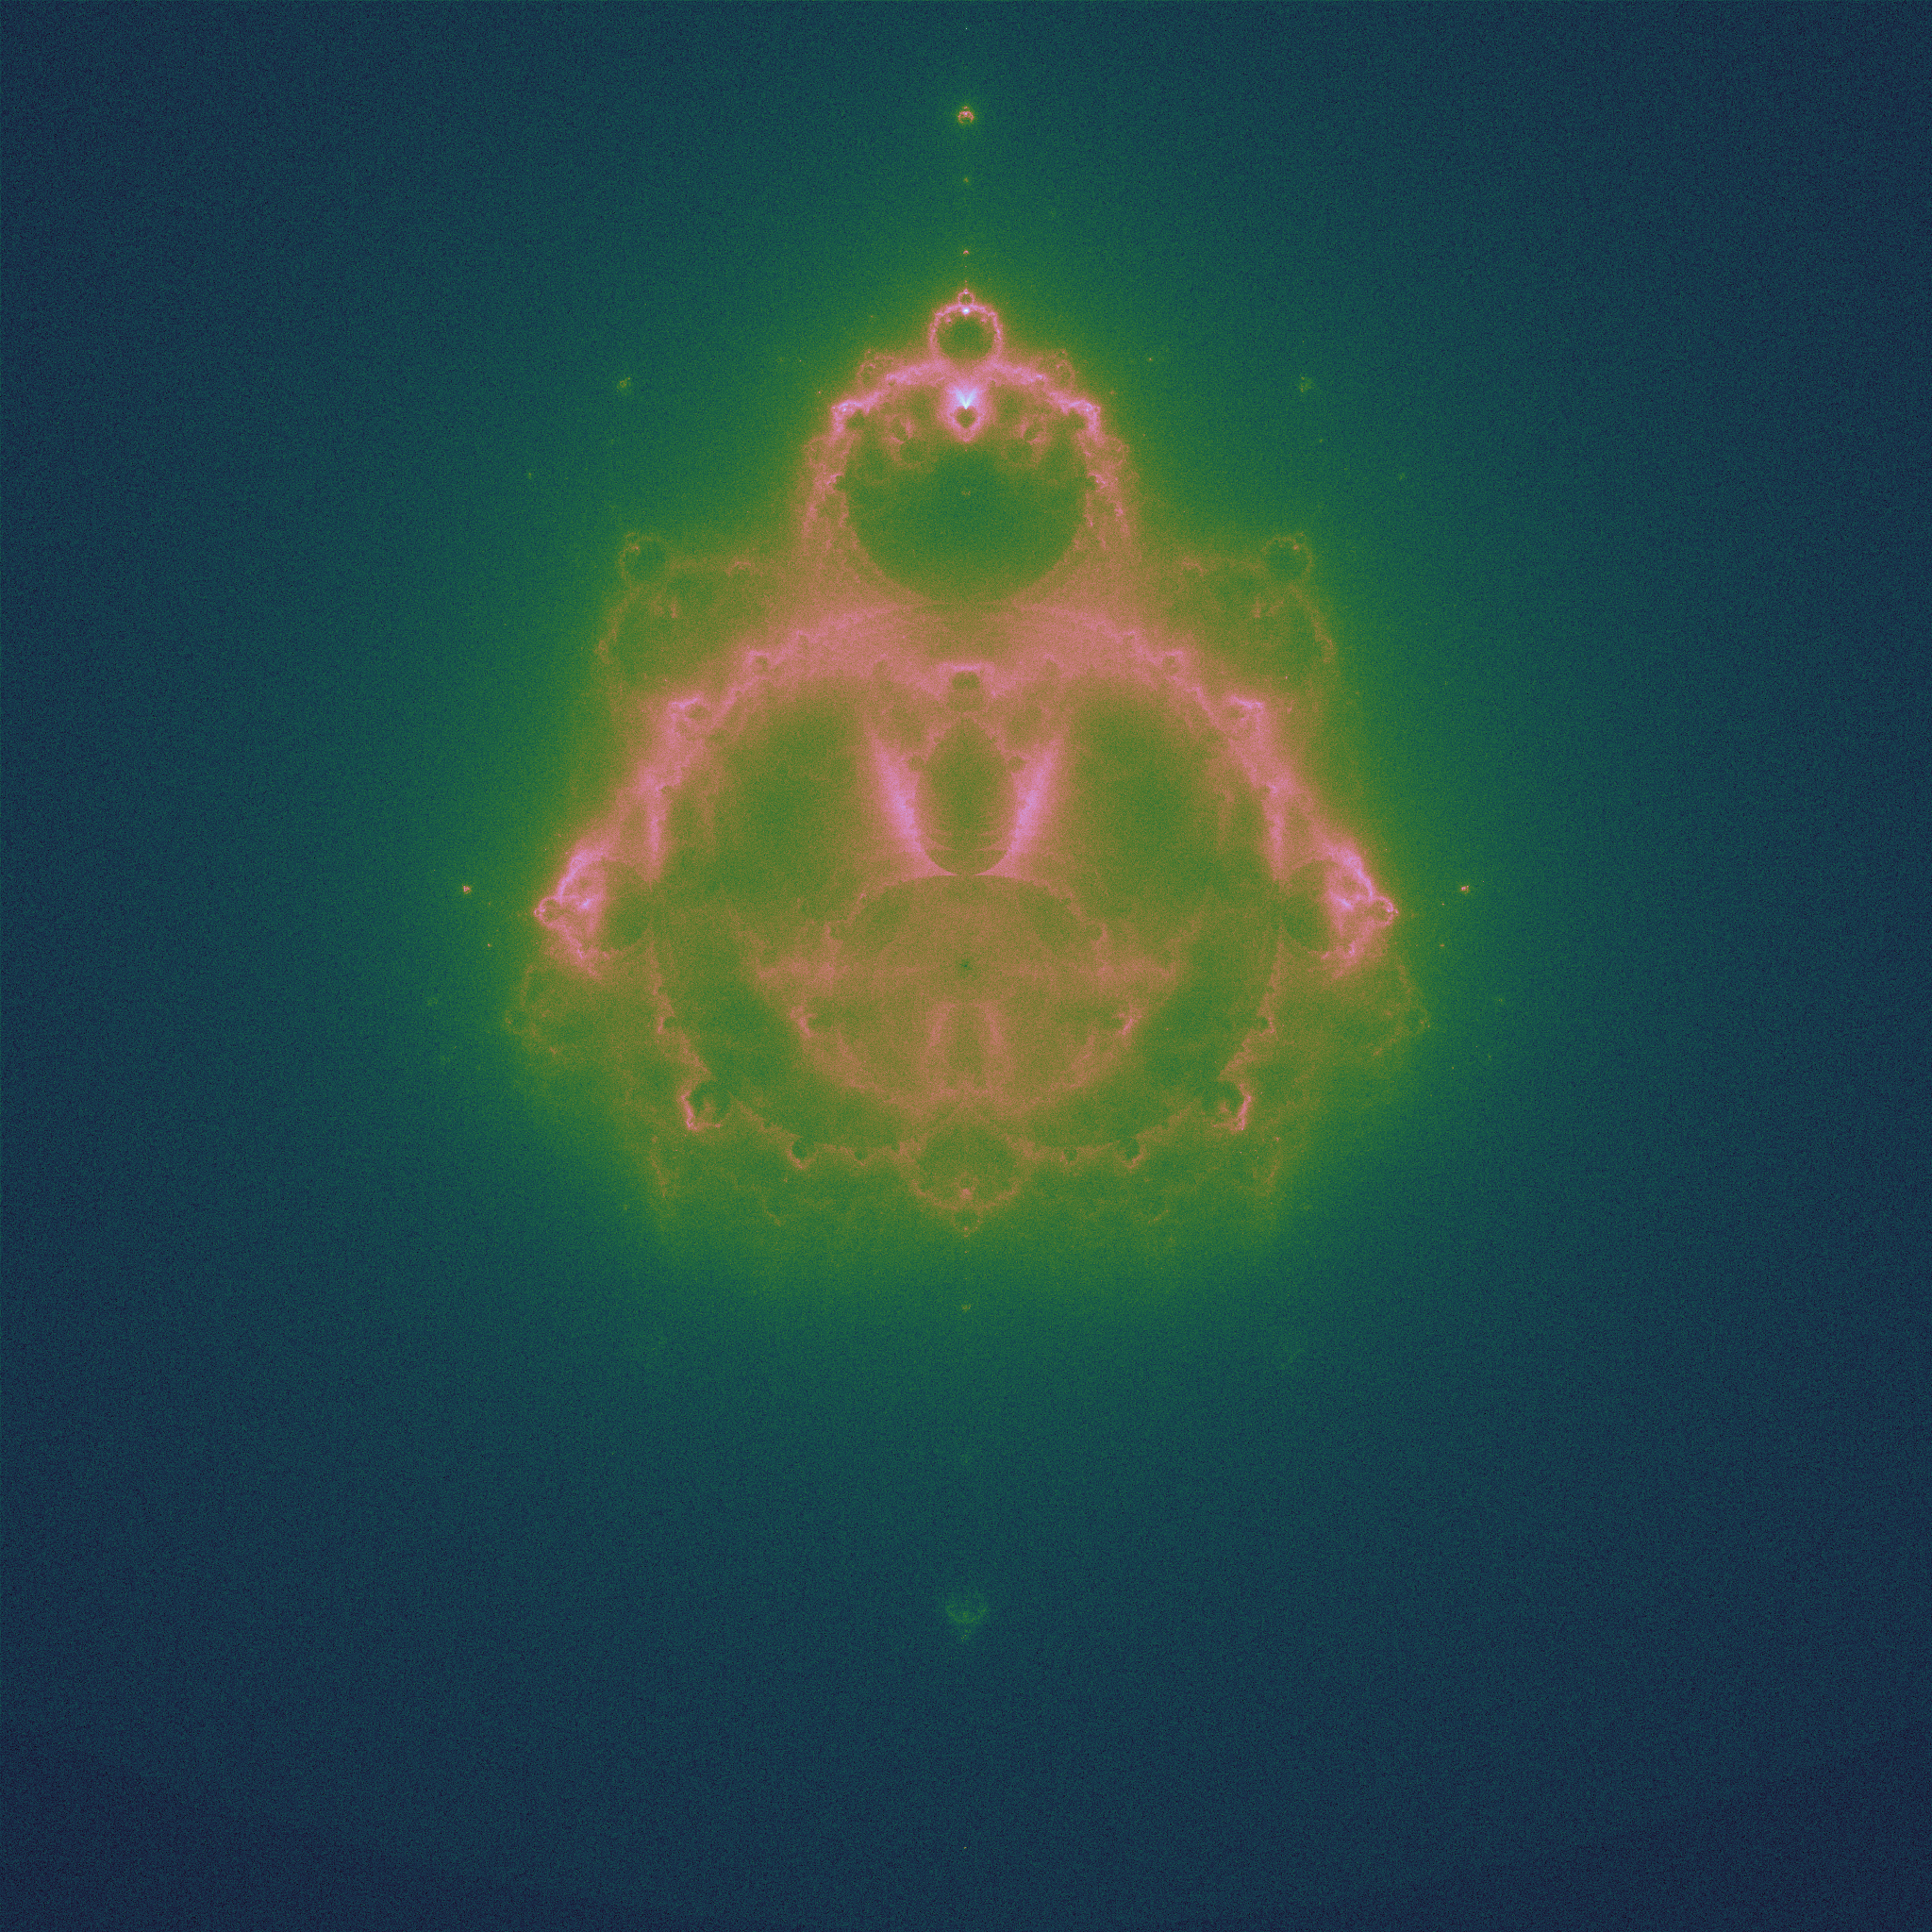
These plots are more are computationally expensive to produce than the plain Mandelbrot set plots: it is good to have a large number of initial points, and a long trajectory run. There are some beautifully detailed figures on the Wikipedia page. |
| \(k = 2.5\), the "piggy-brot" |
 |
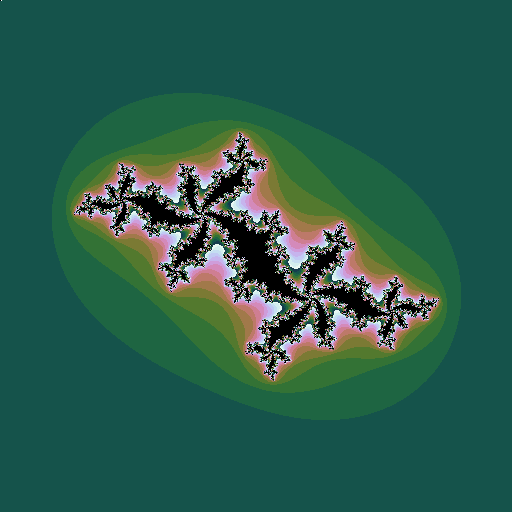
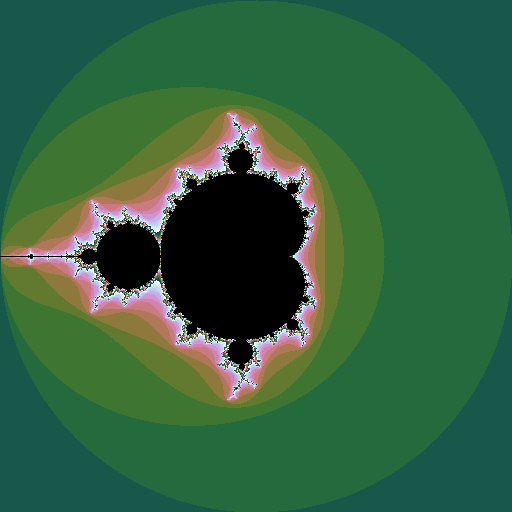
| \(c = -0.5+0.5i\), a point well inside the Mandelbrot set |
 |
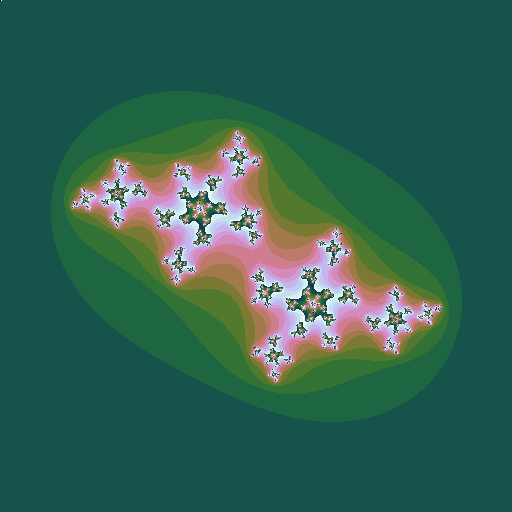
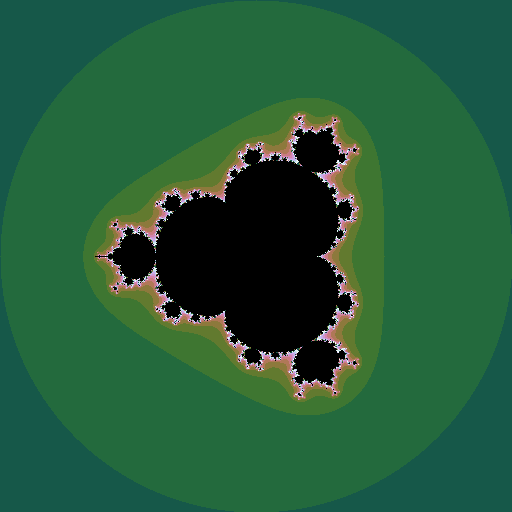
| \(c = -0.5+0.6i\), a point just inside the Mandelbrot set |
 |
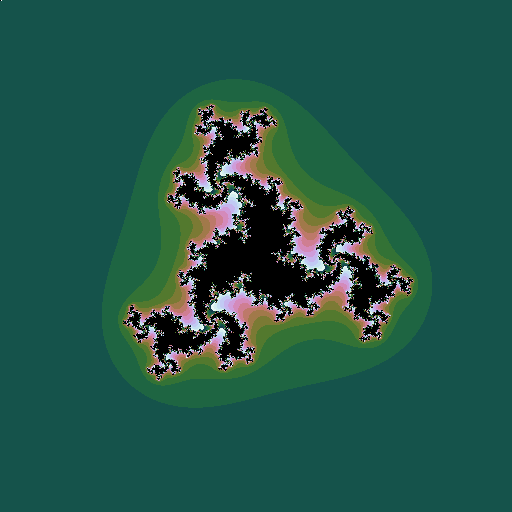
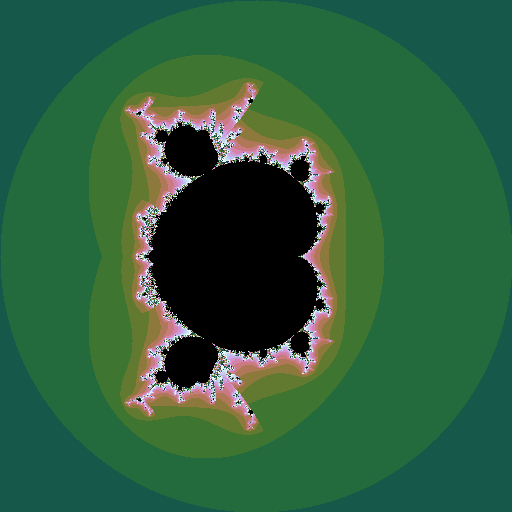
| \(c = -0.5+0.7i\), a point outside the Mandelbrot set |
 |
| Julia sets mapping out the Mandelbrot set |
 |
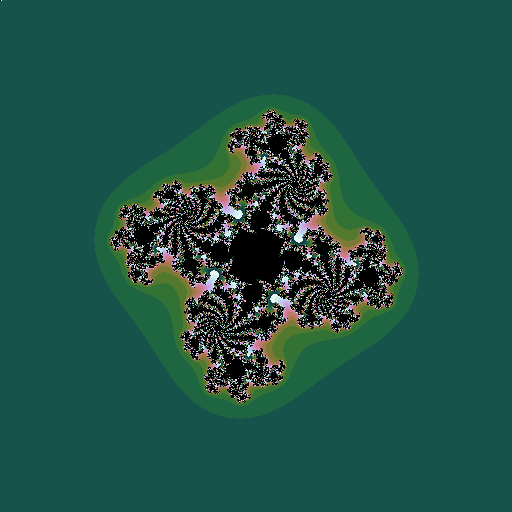
| \(k=3, c = -0.5+0.598i\) |
 |
| \(k=4, c = -0.5+0.444i\) |
import numpy  as np
import matplotlib.pyplot as plt

IMSIZE = 512 # image width/height
ITER = 256

def julia(z, c, k=2):
    # z = position, complex ; c = constant, complex; k = power, real
    z = z
    for i in range(1, ITER):
        z = z ** k + c
        if abs(z) > 2:
            return 4 + i % 16 #16 colours
    return 0

julie = np.zeros([IMSIZE,IMSIZE])
c = np.complex(-0.5,0.5)

for ix in range(IMSIZE):
    x = 4 * ix / IMSIZE - 2
    for iy in range(IMSIZE):
        y = 2 - 4 * iy / IMSIZE
        julie[iy,ix] = julia(np.complex(x,y), c, 5)

julie[0,0]=0   # kludge to get uniform colour maps for all plots

plt.axis('off')
plt.imshow(julie, cmap='cubehelix')
plt.show()
 |
| iterating \(z^4 + c\) |
 |
| iterating \(z^{2.5} + c\) |
 |
| \(k = 1 .. 6\), step \(0.05\) |
import numpy  as np
import matplotlib.pyplot as plt

IMSIZE = 512 # image width/height
ITER = 256

def mandelbrot(c, k=2):
    # c = position, complex; # k = power, real
    z = c
    for i in range(1, ITER):
        if abs(z) > 2:
            return 4 + i % 16 #16 colours
        z = z ** k + c
    return 0

mandy = np.zeros([IMSIZE,IMSIZE])
for ix in range(IMSIZE):
    x = 4 * ix / IMSIZE - 2
    for iy in range(IMSIZE):
        y = 2 - 4 * iy / IMSIZE
        mandy[iy,ix] = mandelbrot(np.complex(x,y), k)

    plt.axis('off')
    plt.imshow(mandy, cmap='cubehelix')
    plt.show()
And there's more. But that's for another post.


an experimental dreamlike video rocking us smoothly through circular moves

someone who lived in an enclave would need a visa to enter the foreign country that surrounded the enclave. However, the only way to get that visa was to travel to a major city in the main body of their country, something that was impossible without illegally entering the foreign country.
 |
| Ely cathedral, in sunlight |
 |
| The famous central Octagonal Tower |
 |
| The decorated ceiling of the nave. The lines across it are Christmas lights! |
 |
| The view back down the aisle |
 |
| Sunlight through stained glass |
 |
| Co-opted pagan symbolism |
 |
| Looking up into the Octagonal Tower |
 |
| Superb stained glass: we need a camera with better dynamic range to do it justice. |
 |
| "Seated one day at the organ, ..." |
 |
| Bishop Peter Gunning looking very relaxed. |
 |
| An explosion of fractal lacework in stone. |
 |
| toothbrush shown for scale |
 |
| screenshot |

 |
| Three transformations (shown in black, red, green), shown by their action on the unit square (grey), produce the Sierpinkski triangle |
x := rnd
repeat
   choose transform w_i with probability p_i
   x := w_i(x)
   plot x
The resulting plot converges to the relevant fractal.
 |
| Here, the black and green transformations are as before, but the red transformation includes a rotation |

 |
| A pentagonal fractal produced by five transformations |
 |
| A “snowflake” produced from four transformations, one with a smaller "shrinkage" than the others |
 |
| A “coral tree” |
 |
| From pentagon to coral, and back. |


