The Buddhabrot takes all the points ourside the set, and plots each point in the trajectory to divergence. This leads to a density map: some points are visited more often than others (it is conventional to plot this rotated 90 degrees, to highlight the shape):
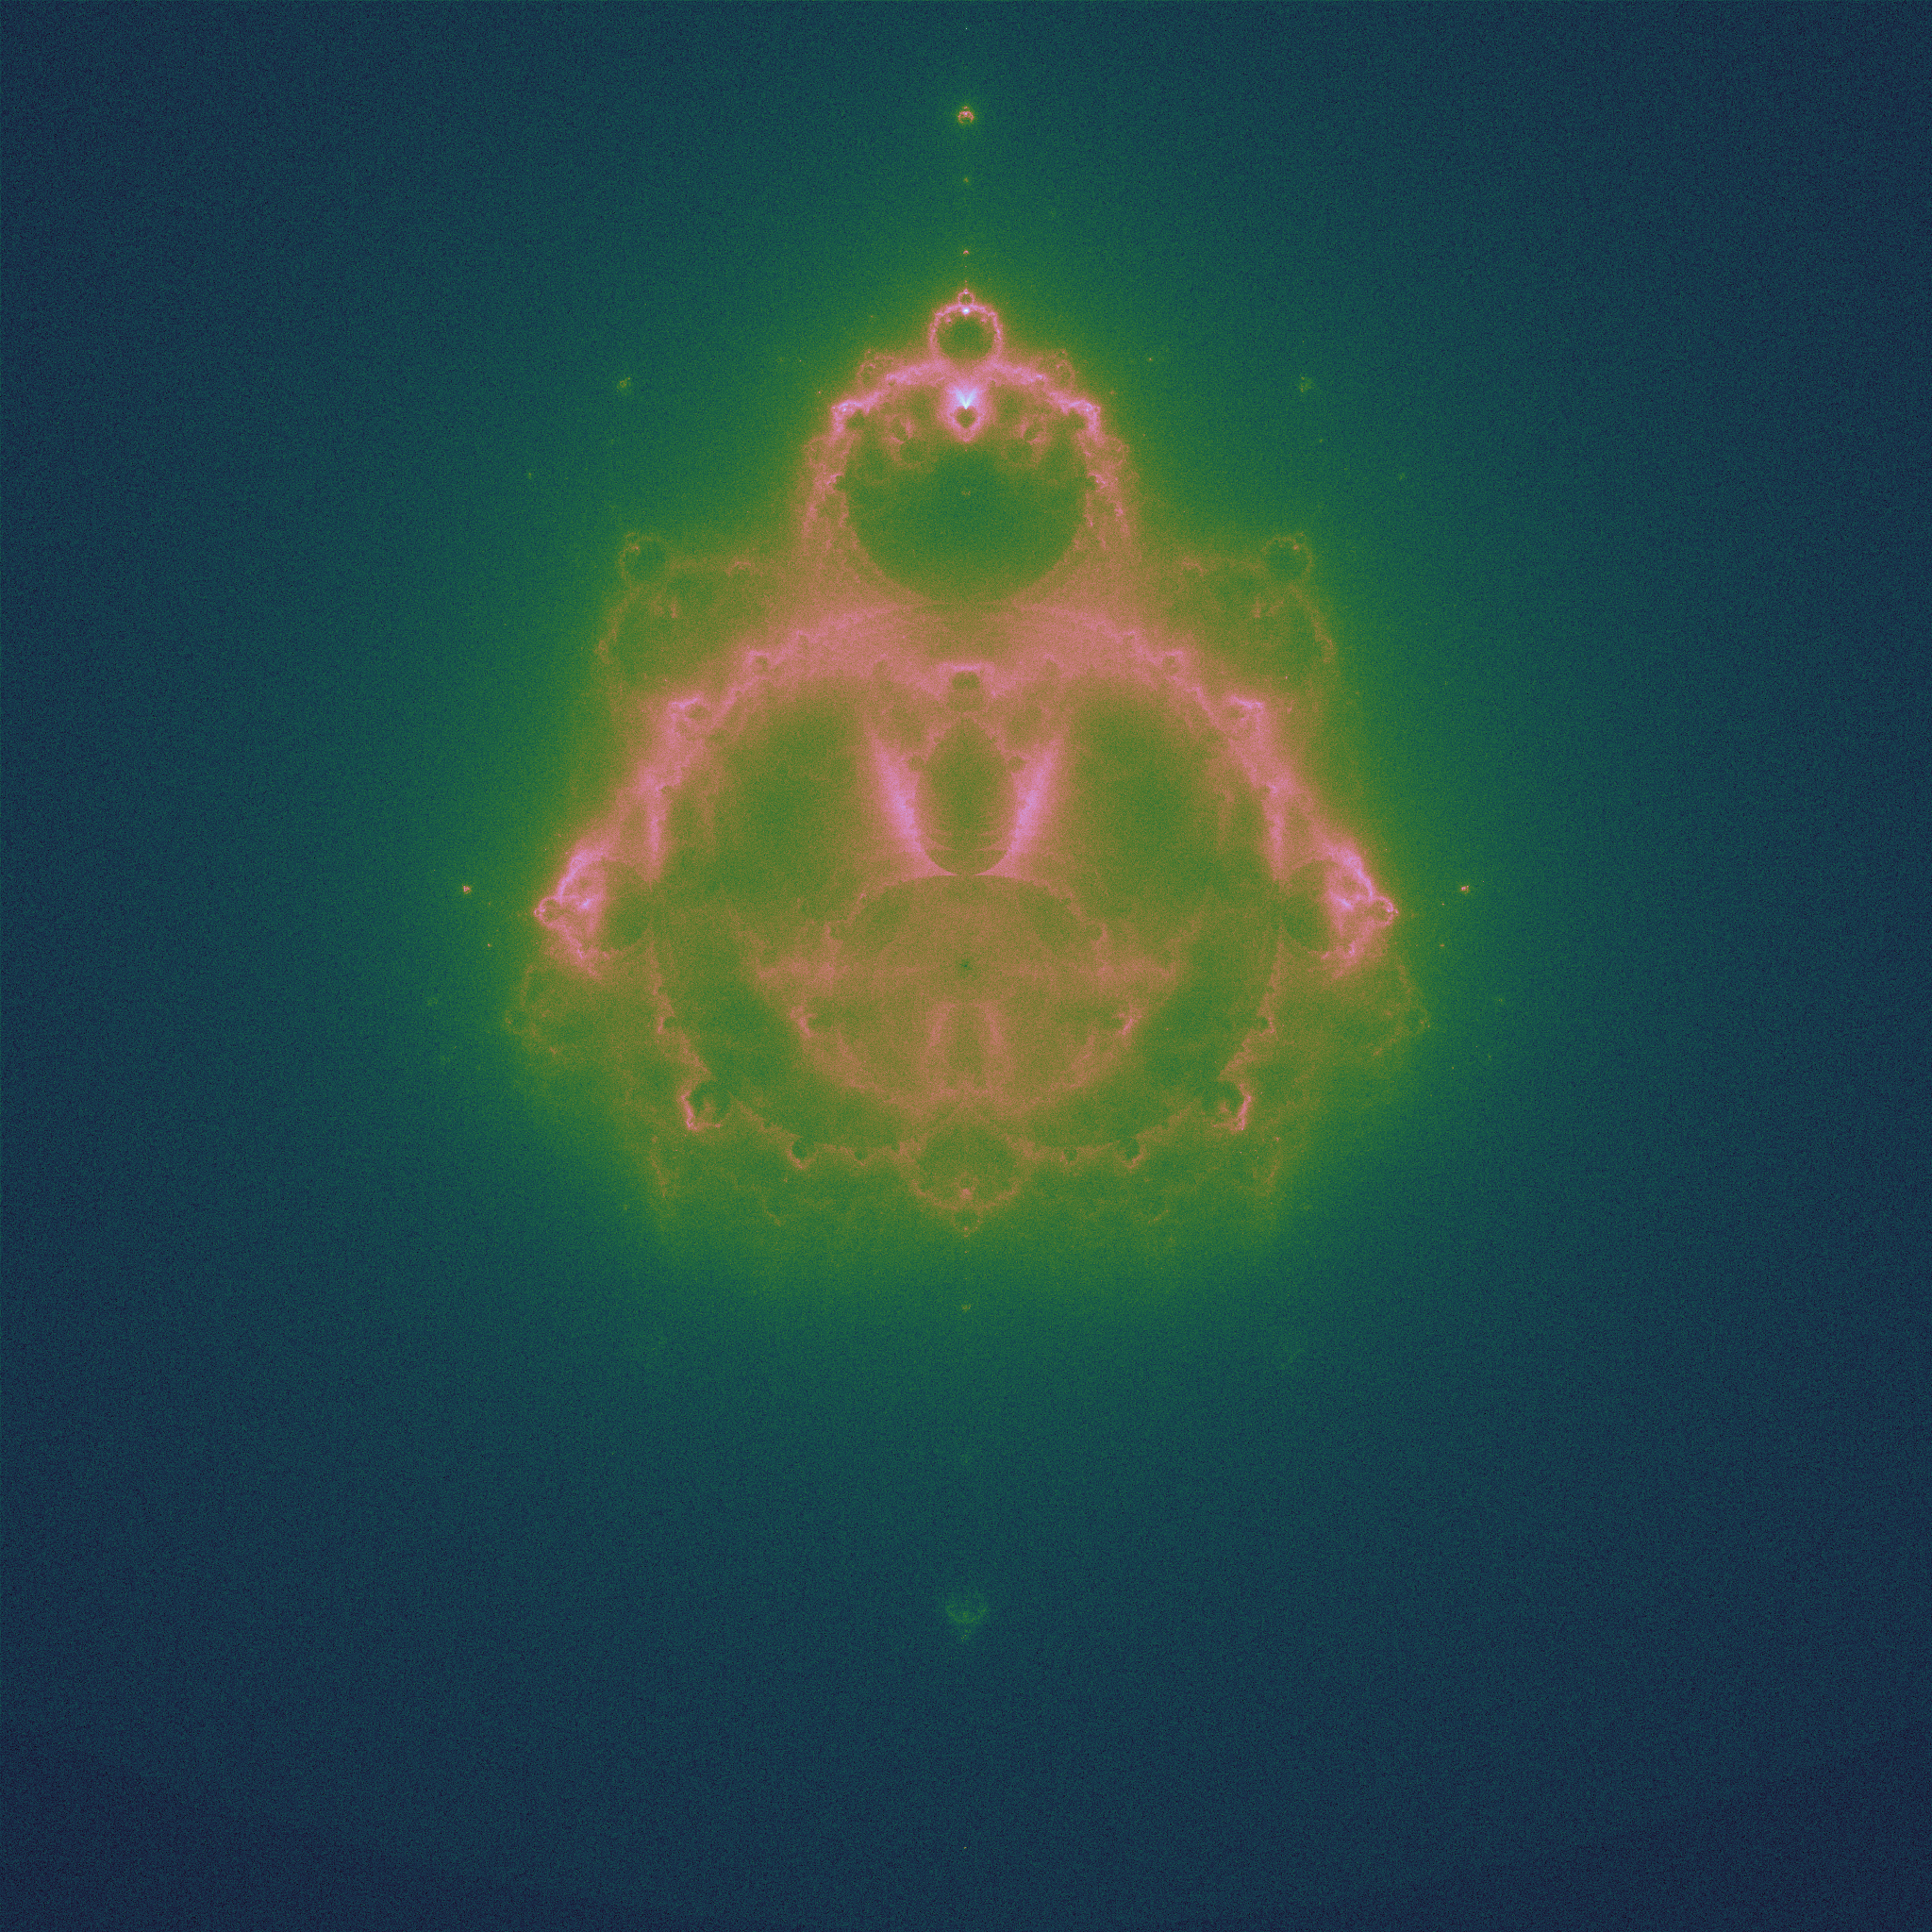 |
| 42 million randomly chosen values of \(c\) |
Again, the code is relatively simple, and you can calculate the Buddhabrot and anti-Buddhabrot at the same time:
import numpy  as np
import matplotlib.pyplot as plt

IMSIZE = 2048 # image width/height
ITER = 1000

def mandelbrot(c, k=2):
    # c = position, complex; k = power, real
    z = c
    traj = [c]
    for i in range(1, ITER):
        z = z ** k + c
        traj += [z]
        if abs(z) > 2: # escapes
            return traj, []
    return [], traj

def updateimage(img, traj):
    for z in traj:
        xt, yt = z.real, z.imag
        ixt, iyt = int((2+xt)*IMSIZE/4), int((2-yt)*IMSIZE/4)
        # check traj still in plot area
if 0 <= ixt and ixt < IMSIZE and 0 <= iyt and iyt < IMSIZE:
            img[ixt,iyt] += 1

# start with value 1 because take logs later
buddha = np.ones([IMSIZE,IMSIZE])
abuddha = np.ones([IMSIZE,IMSIZE])
for i in range(IMSIZE*IMSIZE*10):
    z = np.complex(np.random.uniform()*4-2, np.random.uniform()*4-2)
    traj, traja = mandelbrot(z, k)
    updateimage(buddha,traj)
    updateimage(abuddha,traja)

buddha = np.square(np.log(buddha)) # to extend small numbers
abuddha = np.log(abuddha)          # to extend small numbers

plt.axis('off')
plt.imshow(buddha, cmap='cubehelix')
plt.show()
plt.imshow(abuddha, cmap='cubehelix')
plt.show()
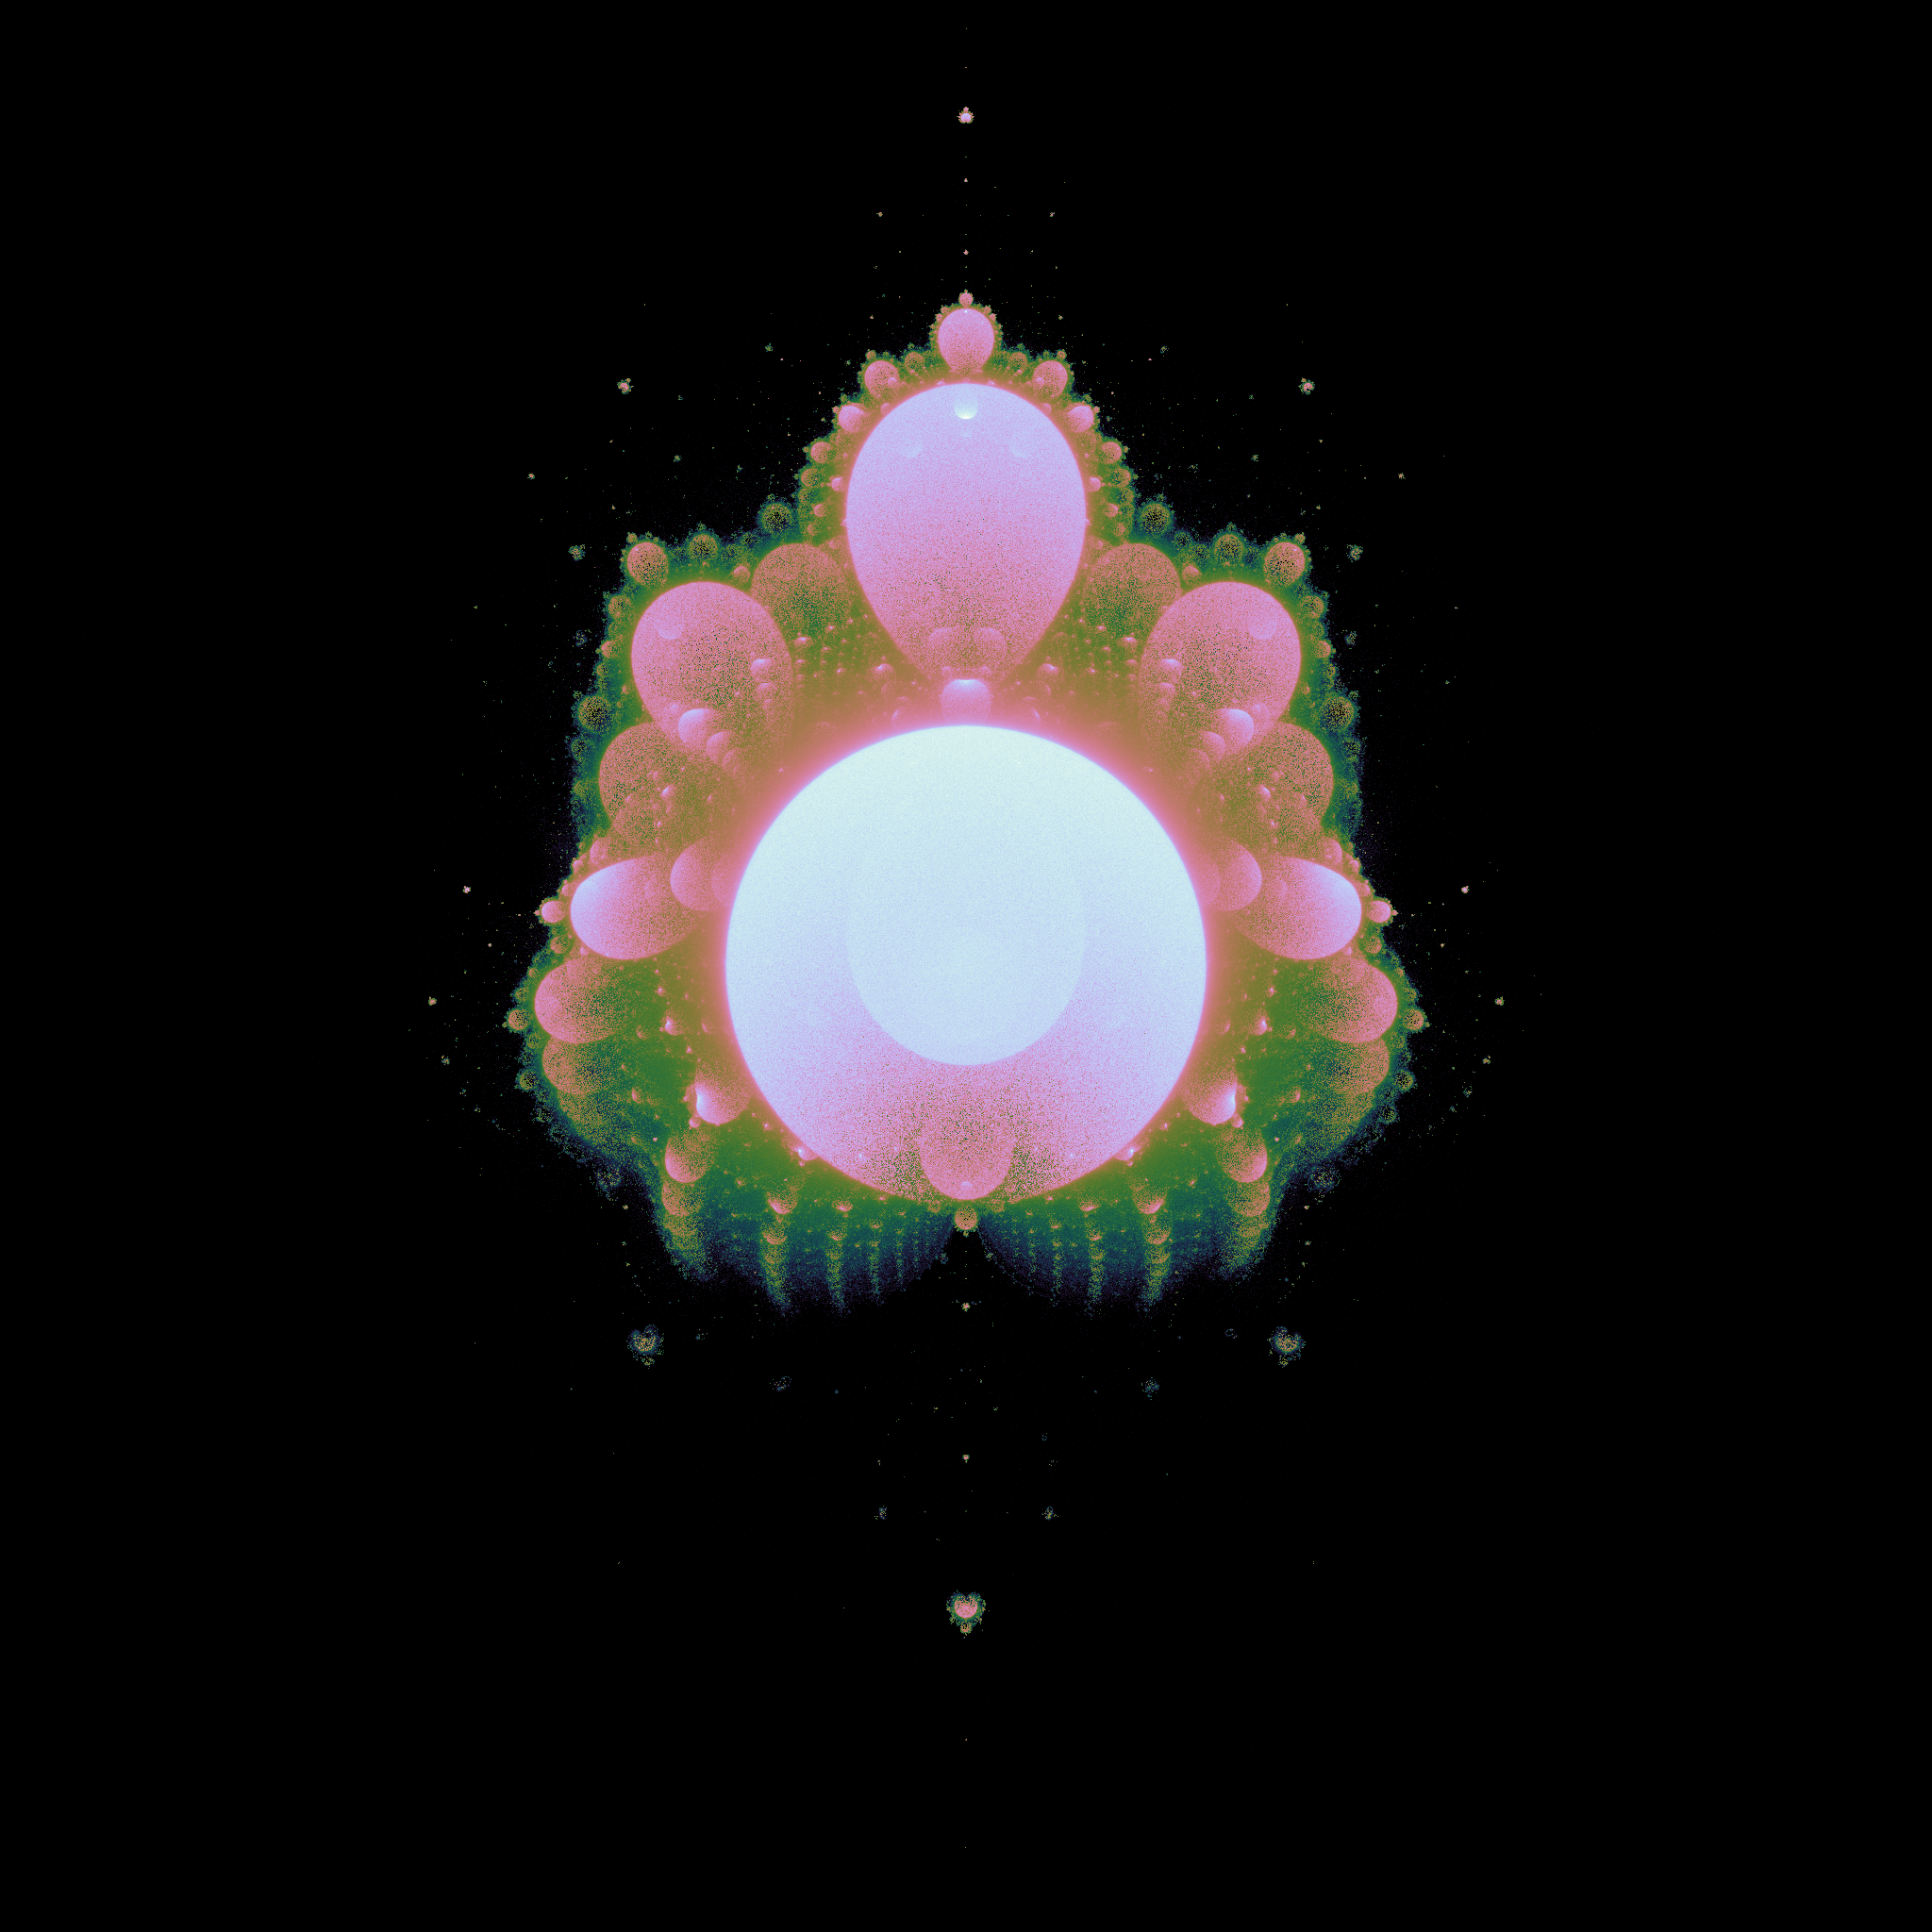
These plots are more are computationally expensive to produce than the plain Mandelbrot set plots: it is good to have a large number of initial points, and a long trajectory run. There are some beautifully detailed figures on the Wikipedia page.As before, we can iterate using different powers of \(k\), and get analogues of the Buddhabrot.
 |
| \(k = 2.5\), the "piggy-brot" |
Hi) Thanks fot guide. I have some questions.
ReplyDeleteI tried to draw buddhabrot with c. My algorythm is based on yours.
I draw buddha in square. When I do z = c, then there are a lot of messy points around circle like this https://yadi.sk/i/irhoSfz6xfhj1A
If z = (0, 0), then there are no such points. https://yadi.sk/i/sYQce840TUFTQw Is that important?
But this is not the greatest problem as you can see :D My picture is very noisy. I think it's cause I have few random c points. But if I increase count of points
for ex. in range(IMSIZE*IMSIZE*10) -> in range(IMSIZE*IMSIZE*100)
then buddha is "burning" o_O https://yadi.sk/i/U_lje8nT0HCG0A is it ok? (I understand that burn-effect is dependent on my color-shema :D)
Also the more points I use the more time it takes to render...:(
Ok, ultimate increase!!!
in range(IMSIZE*IMSIZE*10) -> in range(IMSIZE*IMSIZE*1000)
https://yadi.sk/i/vZs6EGCsM06LfA
It doesn't look the same as your result :D What's wrong? :(((