Showing posts with label electricity. Show all posts

Saturday, 11 October 2025

After ALife

My colleague and I travelled back to Tokyo on the bullet train this morning.  I had quite a bit of time before my flight, so he suggested we visit Electric Town.  We took a local train, then searched for some empty luggage lockers so we wouldn't have to wheel suitcases around.  All the coin-operated ones we found were full.  But we did find an alternative.

A very nice gentleman took our bags and gave us a ticket.

Divested of luggage, we walked around, marvelling at the sheer variety of stores selling everything electrical, electronic, technical, cutesy twee, and much that was unidentifiable.

A huuuge multistorey shop sold large expensive items, including mega-sized TVs, bicycles, telescopes, and sharks.

I've been to specialist telescope shops with fewer items on display.

Difficult to get a scale, but this was several feet tall.

At the other extreme, there were alleyways and arcades with tiny shops selling all kinds of electronics, from small boxes full of individual resistors and transistors, to crates full of old laptops.  Everything for the hobbyist.

One shop among hundreds.

It was lightly raining and getting dark: the combination of weather and goods made me feel like I was on the set of Bladerunner.  

After that, we retrieved our luggage, and I caught a train to the airport, to wait for my just after midnight flight home.  

I like the simplicity and clarity of the airport shop names.


The end of my third trip to Japan.


Saturday, 30 March 2024

view from a hotel window

We're at Levitation, the 2024 Eastercon, being held this year at the Telford International Centre (TIC). It's a new venue for Eastercon, and is nice and spacious (great for social distancing) and well laid out.  There are also nice gaps between items, so no need to teleport around the TIC.  So far, we've been to:

  • a panel on SF and the Industrial Revolution -- a theme of the convention, given that Ironbridge is just down the road
  • a talk by Kari on the history of the Welsh border -- also close by, and surprisingly ill-defined
  • a talk about bones and forensics -- not all found bones are human: "the last time this bone was above ground, it was surrounded by cow"
  • a panel on narrative point of view and tense -- which has moved from traditional 3rd person past tense to more 1st person present tense, especially in Young Adult fiction
  • an enraging talk by Clute on the British Library's destruction of 100 years of dust jackets
  • a panel on libraries, in the real world and in SF -- "getting my adult card which allowed 4 books a fortnight meant you were supposed to read 4 a fortnight!"
  • a panel on Dr Who and the Industrial Revolution, including the 1985 story of The Mark of the Rani
  • a panel on Educational Safeguarding in SF/F -- fictional schools seem very dangerous!
  • a talk by Emma King on her unsuccessful applications to be an ESA astronaut, and the other successes that led from that 
  • a panel on (fictional) Invertebrates in Space -- including interesting discussions of real invertebrates (on Earth), too
We're looking forward to more great stuff tomorrow and Monday.

We're staying at the hotel next door to the TIC, with the customary view over the car park:

at least we can keep an eye on our car...

We drove up to Telford yesterday, in our new electric car.  I still have a little range anxiety, so when we stopped for lunch, I did give it some juice, despite the prediction we'd have enough left when we arrived.  Note to self: when travelling on a Bank Holiday, charging points tend to be well-occupied.  The hotel has four of its own fast (22kW) charging points for guest use, that are not quite as eye-wateringly expensive (70p/kWh) as service station chargers (~79p/kWh), so I will fill up tonight, ready for the trip home.  A bit different from the 9p/kWh I can get at home on the overnight rate, though.


Later: for more notes on the convention, see my website


Sunday, 29 October 2023

uninterrupted

At home, we have sufficiently frequent (several times a year) micro power cuts (lasting only a few seconds) to be irritating: the computers all crash, and when they turn back on, there are lots of little passive-aggressive complaints about having been switched off incorrectly, and not to do it again, naughty, naughty.

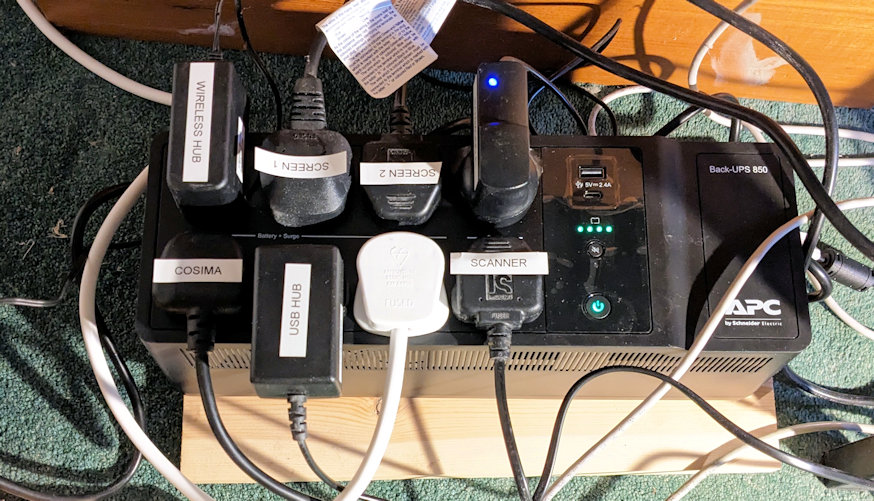
So the latest toy is a UPS, now set up and sitting behind my desk:


It has six sockets on the UPS part (used by my computer and screens, and bits of the network), and two sockets that are just surge protected (scanner and a Raspberry Pi).  It's essentially a lead acid battery, hence sat on a piece of wood rather than directly on the floor, just in case.

We tested it by switching off its mains connection: my system and the network kept running.  The monitoring software claims the battery has about half an hour of capacity; moreover, it will shut the computer down properly if that is needed.

So we'll probably never have another power cut.  But that means it's working one way or the other!


Monday, 5 June 2017

there should be fail-safes in place


no longer the go-to advice to computer users

British Airways says IT chaos was caused by human error 
an engineer disconnected a power supply, with the major damage caused by a surge when it was reconnected.
but the commentators are sceptical:
an email leaked to the media last week suggested that a contractor doing maintenance work inadvertently switched off the power supply. 
The email said: "This resulted in the total immediate loss of power to the facility, bypassing the backup generators and batteries... After a few minutes of this shutdown, it was turned back on in an unplanned and uncontrolled fashion, which created physical damage to the systems and significantly exacerbated the problem." 
But the BBC's transport correspondent, Richard Westcott, has spoken to IT experts who are sceptical that a power surge could wreak such havoc on the data centres. 
BA has two data centres about a kilometre apart. There are question marks over whether a power surge could hit both. Also, there should be fail-safes in place, our correspondent said.


For all my social networking posts, see my Google+ page

Saturday, 22 April 2017

free from coal

No coal was burnt to make electricity in the UK yesterday:
First coal-free day in Britain since Industrial Revolution 
Friday is thought to be the first time the nation has not used coal to generate electricity since the world’s first centralised public coal-fired generator opened in 1882, at Holborn Viaduct in London. 
Cordi O’Hara of the National Grid said: "To have the first working day without coal since the start of the industrial revolution is a watershed moment in how our energy system is changing.
I think you’ll find that the industrial revolution started somewhat earlier than 1882, however.
half of British energy on Friday came from natural gas, with about a quarter coming from nuclear plants
Burning natural gas isn’t exactly carbon neutral, either.

Given Friday was cloudy where we were, we actually used a small amount of grid electricity.  It was much sunnier earlier in the week.  On Friday, our solar panels generated a mere 12.7 kWh, while on Wednesday they generated 51.4 kWh.  I assume overall demand is lower on a Friday.


Update 6 May 2017: I see the BBC page has removed its reference to the Industrial Revolution.


For all my social networking posts, see my Google+ page

Wednesday, 14 October 2015

inflated savings

We had our solar PV system installed in January 2014, and we’ve seen a drop in our external electricity consumption since then.  But how big a drop?  Our electricity company provides a handy annual summary.  Here’s the relevant figures from the first year:


So we almost halved how much electricity we bought in last year (with PV) compared to the previous one (without PV).  Excellent!

But note the start date for the comparison: 9th October.  That means we had the solar PV for only 9 months of the period.  So it should be even smaller this year!  Here’s the relevant figures:


And yes, there’s nearly a 20% drop this time.  Great.

But hang on a minute!  The first chart says we used 4323 kWh last year, whereas the second chart says we used 5611 kWh last year!  That’s a difference of 30%, over the same time period. Huh?

I wondered if it was because the figure is an estimate, and maybe they underestimated our consumption last year (and by a lot), and now have better figures.  So I checked the electricity bills themselves.  But the bill dated 26 Sept 2014 is based an actual meter reading, not an estimate.  So they only had to estimate about two weeks usage.  (The bill from the same period a year earlier was an estimate, however.)

Because we have to send in quarterly PV meter readings to claim our generation tariff, we now make a note of all the different meter readings.  So I know that our actual consumption 10 Oct 14 – 9 Oct 15 was 4576 kWh, very close to their estimate (this year, at least).

We had a new electricity meter installed in March 2014, to cope with the PV system’s generation, but that was in place when last year’s figures were estimated.  The only thing I can think is the estimating system has got very confused somehow, due to our sudden change in usage pattern.  I will have to check next year to see if the figures are equally bizarre, or have settled down.

This is not the first time I have had perplexing information on electricity bills, though (for a different location).

Sunday, 29 March 2015

good unintended consequences

Electric cars may reduce your air-conditioning bill?

Using summer 2012 in the Chinese capital of Beijing as an example, the team estimate that replacing conventional cars with electric ones could have reduced the heat by nearly 1 °C. That in turn would result in a reduction in air conditioning use in the city, leading to a drop of 10,686 tonnes in daily CO2 emissions.  [New Scientist]


For all my social networking posts, see my Google+ page

Thursday, 8 January 2015

Saturday, 5 April 2014

a new view of solar stats

March is over, so we have another month of solar power generation statistics.  Looking at the sunniest day (as determined by total power generation) of each month, we see:


The horizontal time axis runs from 3:00am to 9:00pm GMT. The vertical axis runs from zero to 8kW. The orange regions indicate the minimum, lower quartile, median, upper quartile, and maximum generation at that time, over the respective month.

The different amount of sunlight month on month is clearly visible.  The total power generated on the sunniest day each month (essentially sunny all day) was 26.5 kWh on 13th January, 41.4 kwH on 16th February, and 52.0 kWh on 24th March.  In the March plot we start to see saturation: we have an 8kW system, and so the top of the curve flattens around noon as the system generates at full capacity.

Of course, one of the reasons we want a solar power system is to use the electricity we generate.  These plots show only generation, not usage, because that's the data the solar power system provides.

So we got another meter: a Wattson monitor, that shows not only power generated, but power used, too.  We download the data weekly as it requires an actual cable to connect the Wattson to a computer (the generation system by contrast shares its data via Bluetooth).


Here the horizontal time axis runs from midnight to midnight GMT/BST. The vertical axis runs from -8kW to 8kW. The region above the axis represents our usage: green is generated usage, red is imported from the grid. The region below the line is surplus generation exported to the grid.  (So the green area corresponds to total generation, or the black line in the plots above.)  During the day, usage tends to track generation.  That's because we have a system that pours excess generation into the immersion heater, up to a maximum of 3kW.

The early evening spike at the weekends is dinner being cooked in the electric oven; during the week we usually use the gas hob.  Looking closely you can often see a small red spike around 7am (when generation is just starting); this is the kettle for my morning coffee.  On the 17th, 18th, 19th, and 26th there is a lot of red: we had the “boost” on the immersion heater switched on, because the gas boiler had a fault, so we had no gas heating.

So just eyeballing these charts, it looks like we might be saving about a third of our electricity bill, in addition to what we get paid for the generated power.  This proportion will probably increase in the summer as the number of hours of daylight increases.

Then, of course, there is all the entertainment value of writing Python scripts to generate the charts, examining said charts, and speculating on the shape of future charts.  Great value for money all round!

Tuesday, 18 February 2014

a surfeit of packaging

My phone started behaving strangely over the weekend: switching off for no reason, then claiming the battery was dead, but when I plugged it in to the charger, claiming the battery was half, then fully, charged.  After some searching on the web, I discovered this probably meant the battery was pining for the fjords.  Maybe not that surprising: it is 2 and a half years old, and has been maxed out on certain games at times.

More hunting on the web, and I found a place selling genuine Samsung batteries (as opposed to much cheaper batteries that the reviews seem to think are rip-offs) at eye-watering prices (I shouldn’t be surprised at the price, I suppose; I recently bought a new battery for my watch, and previously a new strap: the combined price was more than that of the original watch).  I ordered one; it arrived promptly today; the phone is now fine.  I have my life back.

Phone batteries are small and compact, so I was expecting a small parcel.  I received the battery in a plastic wrapper, in a jiffy bag, in a plastic envelope:

a lot to recycle…


Saturday, 11 January 2014

cloudy afternoon

Here’s today’s solar PV electricity generation, from sunrise (8:05 GMT) to sunset (16:09 GMT), with data points every 5 minutes.  We generated 25.1 kWh in total.

vertical scale: kW; green line: total energy generated; blue line: energy generated from top row of 15 panels; brown line: energy generated from bottom row of 12 panels

Despite the weather forecast being for clear skies all day, there were large clouds this afternoon for the sun to hide behind.  So we were right to run the washing machine this morning.

Maybe it was hiding because of its spots.

Today’s sun, with its enormous spots. Image from NASA’s current solar images page

Friday, 10 January 2014

PV chart II

Here’s today’s solar PV electricity generation, from sunrise (8:06 GMT) to sunset (16:07 GMT), with data points every 5 minutes.  We were getting nearly 6kW at one point!  We generated 19.8 kWh in total, twice as much as yesterday.

vertical scale: kW; green line: total energy generated; blue line: energy generated from top row of 15 panels; brown line: energy generated from bottom row of 12 panels

The scaffolding was removed during the morning, and hence isn’t shadowing the lower row of panels in the afternoon.  So the brown line is closer to the blue one then.  It was sunny all morning, and a little hazy all afternoon.  We have a very sensitive sunshine detector!

Tomorrow’s weather forecast is for sun all day, so I’ll post one more chart, but that will be enough, as I suspect that they are really of interest only to us.  (There will probably be some monthly and annual stats, of course.)

Thursday, 9 January 2014

PV chart

We downloaded today’s data from the inverters this evening, and we can see the electricity we generated, from sunrise (8:06 GMT) to sunset (16:06 GMT), with data points every 5 minutes.

vertical scale: kW; green line: total energy generated; blue line: energy generated from top row of 15 panels; brown line: energy generated from bottom row of 12 panels

The top row of panels didn’t start generating until later, as they need a bigger voltage to kick their inverter into life.  It was cloudy and gloomy in the morning, but around midday, the low winter sun came out, and generation leapt to 4kW.  The afternoon stayed sunny, and the curve is essentially tracking the setting sun, with occasional cloud.

The brown line is somewhat less than 12/15 = 80% of the blue one, partly from shading from the scaffolding poles (due to be removed tomorrow), and partly from being lower on the roof.

That’s a total of 9.5 kWh generated on a winter’s day, when the sun was above the horizon for a total of 8 hours, and it was cloudy until noon.  So that’s about £1.30 due from the feed-in tariff.  Not bad.  Now we have to replan our electricity usage patterns to coincide with when the sun shines.

PV generating

Today was the first full day of PV solar generation.  We weren't particularly hopeful, as the forecaset this morning was quite gloomy

gloomy, but not as bad as the same forecast yesterday
It now being light, I had a chance to see the full installation.

all 27 solar panels installed
By noon, this lot was generating over 4kW, which is about 50% of total capacity.  That's not bad, given how low the sun is this time of year (which you can tell from the shadow of the soil stack in the middle of the roof), plus shadows being cast by the scaffolding.  Given our idling consumption seems to be around 1kW, we are now officially an energy exporter!

Also note the colour of the sky.  Blue, and clear.  At noon.  And it stayed blue and clear for the whole afternoon, until around sunset (4pm).  So much for weather forecasts.

Wednesday, 8 January 2014

PV installed

Our solar PV system took three full days to install, a bit longer than originally planned, because of some foul weather: wind, hail, rain, but finally some sun.

the “Sunny Boy” DC to AC inverters installed in the attic
The inverters have a Bluetooth interface, and we have downloaded the software that lets us monitor our total generation.  It produces charts, and data at 5 minute intervals in csv format.

Downstairs we have more devices to play with.  There’s the offical meter (to let the electricity company know how much we have generated), the Big Red Button to turn off the system, a small black box monitoring total electrical usage, and a box to send any excess generation into the immersion heater.

gizmos
The other end of the total usage monitor displays how much electricity we are using from the grid:

we’re using over a kW, and we’re not doing anything! (4W of that is the box itself.)
And it displays how much electricity we are generating:

0W being generated: well, it is night time!

We did generate some electricity today, though.  The data downloaded from the inverter shows when this generation occurred, from system switch on around 14:50, until sunset:

no generation after sunset!

Tomorrow will be our first full day of generation.  Hopefully we will get more than a little blip on the chart.  But the weather forecast?  Cloudy, of course!

tomorrow: cloudy, with a hint of sun just before sunset

Monday, 6 January 2014

PV delivered

Our solar PV system has been delivered.  It will be installed over the next few days, provided the weather stays calm enough!

DC to AC inverters, plus other bits and bobs, being stored in our garage for now


27 solar PV panels, that won't fit in the garage, so are being stored outside

Thursday, 2 January 2014

part way to PV

We're in the process of having an 8kW solar photovoltaic panel system installed on our roof. This will take a few days.

Today, the scaffolding was erected.

the scaffolding truck: a bit of a tight squeeze down our narrow drive

scaffolding erected to provide access to our south-facing roof
Notice how blue the sky is?  The sun is shining!  But we're not generating any electricity yet.

Thursday, 25 August 2011

the future price of electricity, part 3

So, in June I blogged a follow-up to the weird estimate npower gave for my future electricity bills. Two months later, and I've had my next quarter's bill (differently weird, there).

The estimate seems to have gone back to a more reasonable amount this time around, so I'm no longer fearing an order of magnitude increase in power bills. I wonder what caused the original glitch?

But I'm going to keep a close eye on these estimates in the future.

Saturday, 13 August 2011

foreign power

I've just returned from a conference in France, having taken my new phone with me. Since the powered-on phone lasts about a day before it needs recharging, and since UK and French power sockets are incompatible, I needed a mains plug adaptor. I took two, and they both worked fine.

I took the cheap and cheerful "Tourist Mains Travel Adaptor". The reviews are contradictory about whether it works in France: it does. The product shown in the advert photo wouldn't, mind you, as it has no hole for the French earth pin (below left). But the one delivered to me does (below right). It's small, light, and cheap.

Tourist Mains Travel Adaptor

Because I wasn't sure if that one would work, I also took a "Swiss Travel Products World Travel Adapter": more expensive, and definitely snazzier. This does the full (UK or EU or US or Australia) to (UK or EU or US or Australia) conversion: it has four sets of sockets on one side, and buttons to extrude one of four sets of plugs on the other. Since all the plug pins can be retracted (below, left), it makes it convenient to carry. I tested the UK plug extrusion (at home), and the EU plug (below, right) in France. The slimline plug has no need for a hole to take the French earth pin.

Swiss Travel Products World Travel Adapter

Verdict: both work. The smaller cheaper one is fine for France. The larger, more expensive one means you need only the one device for all your foreign power needs.

So I had a fully charged phone all week, and could neurotically check my email several times a day.


UPDATE (27 Aug 2011): they both work in Norway, too.

Saturday, 4 June 2011

the future price of electricity, part 2

In February, I blogged about a strange item on my electricity bill: npower's estimate of my next year's bill, which was nearly an order of magnitude higher than my current usage.

I've just had this quarter's bill. Same low usage, same high estimate. This made me go back and look at previous bills: had the estimates always been this high?

annual electricity prices
No. The previous two quarters had estimates of about the right amount. Earlier bills had no such estimates: it must be a new "feature". The graph here shows a plot of actual annual consumption (calculated every quarter) and npower's estimate of annual consumption.

The only data points in common (because, of course, I don't yet know my future annual consumption) are very close. Maybe npower do know something about electricity price inflation?

I'll know better in a couple of quarters time...